Throughout my electrical engineering degree, I have learned valuable skills in each course that I can use in the future. As such, I have listed some of my key takeaways from classes that I have taken. This page in particular details my second year, second semester, in the Integrated Learning Stream pilot project. This pilot aims to give students better hands-on skills through a learning environment where lab equipment is readily available and labs are tied into lecture.
ENEL 369: Computer Organization
One of my key takeaways from this course was how to use a PIC microcontroller. PICs are very similar to Arduinos in that they can be programmed to perform whatever task you want them to perform. What I found the most interesting about PICs is just how low-level they are compared to an Arduino. As such, signal outputs from our programming were surprisingly clean and I have gained new appreciation for these devices. Through our PIC labs, we were able to control LED using a button-triggered sequence. In addition, my group was also successful in generating a sine wave using the PIC’s DAC output with a value lookup table.
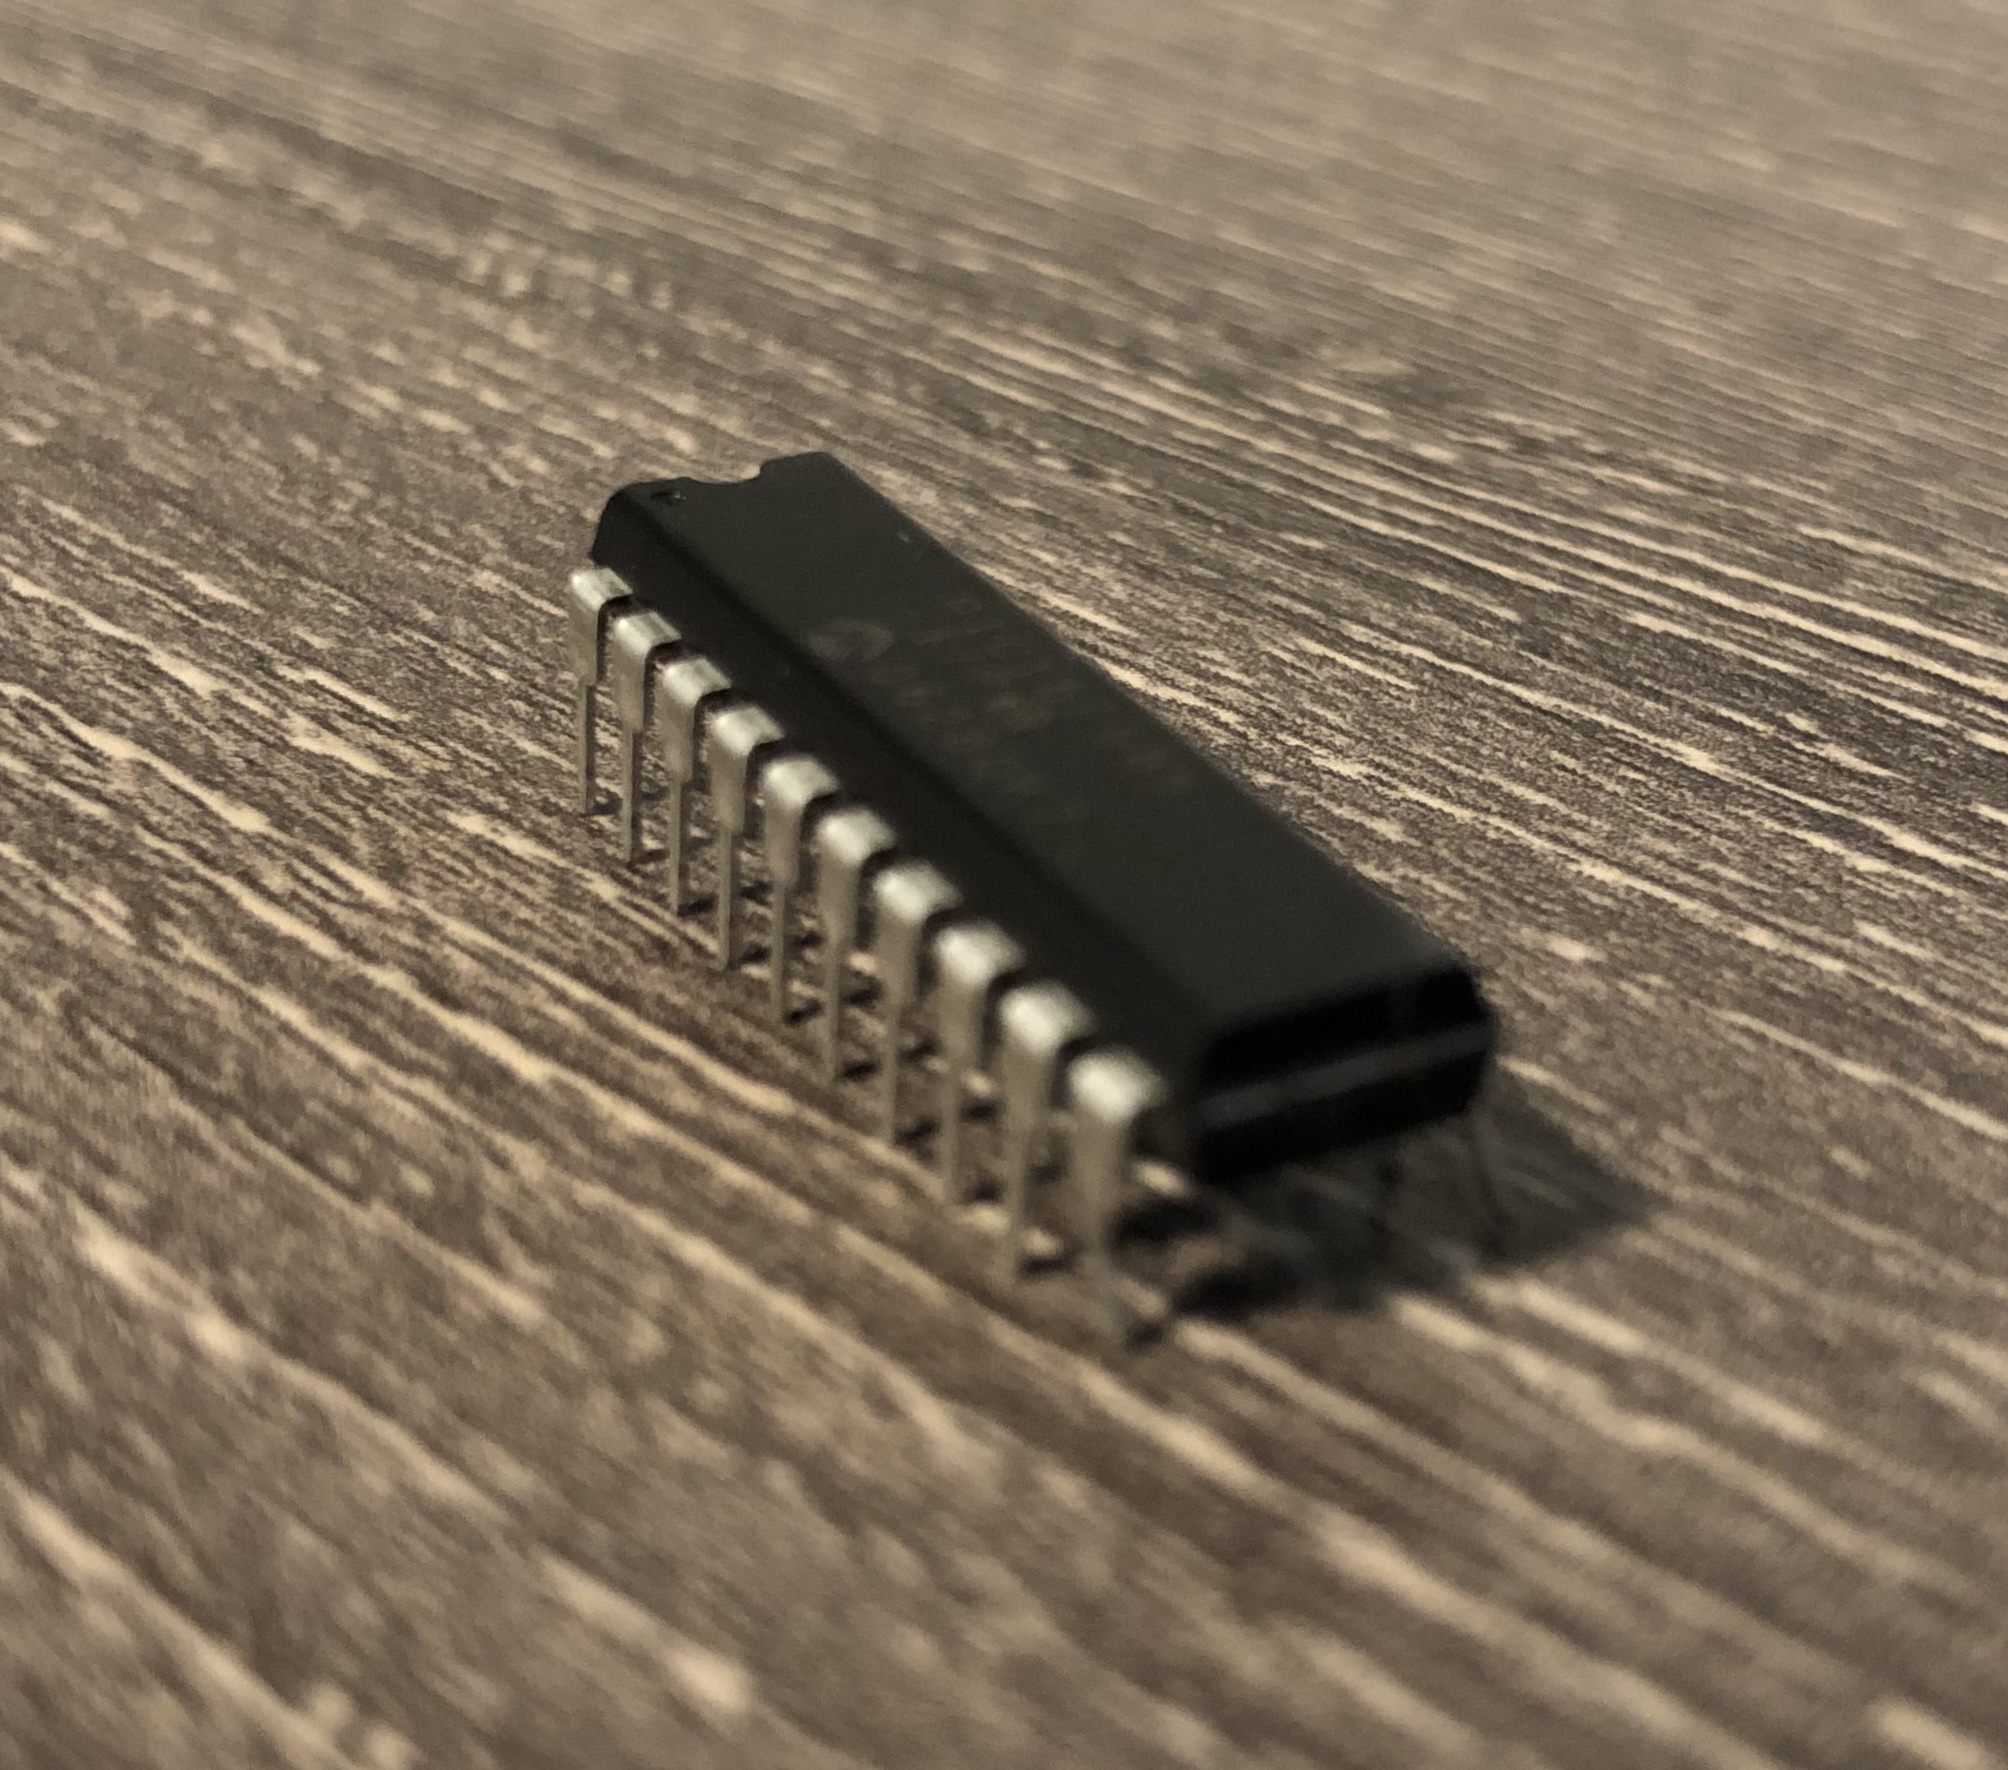
PIC16F1778, our choice of microcontroller for labs
ENEL 327: Signals and Systems
As part of our Signals and Systems course, we were asked to design learning material for a certain topic that we chose. Our group decided to focus on the Fast Fourier Transform, an integral part of modern computing. To teach students about the FFT, and it’s benefits compared to a simple discrete Fourier transform, we created a series of lecture videos similar to YouTube tutorials that detailed:
- Computational complexity using Big O notation
- Examples of the massive time savings from FFT algorithms (number of instructions and modern computer FLOPS speed)
- How the FFT works behind the scenes
Our group also created an accompanying worksheet which guides students to:
- Create their own DFT function in Matlab
- Apply their DFT function, and the built in FFT function to analyze a sum of sinusoids
- Similarly, use both DFT and FFT functions to analyze a sum of sinusoids with random noise added
- Create their own FFFT method (Finite Faster Fourier Transform)
Here is an excerpt from our worksheet:
Applying DFT and FFT to a sum of sinusoids
Let’s define our input signal, x
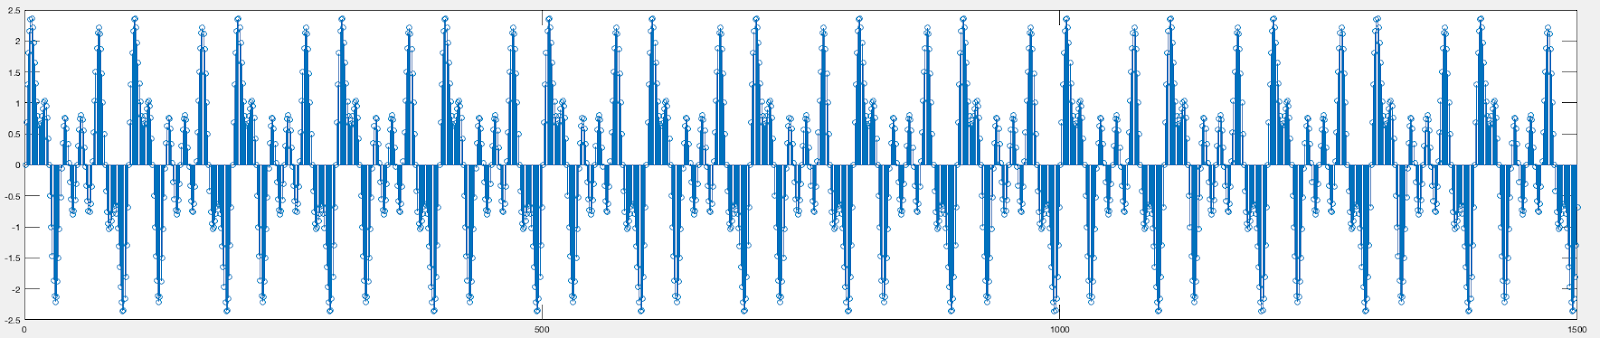
x = sin(20*2*pi()*t)+sin(30*2*pi()*t)+sin(60*2*pi()*t);Let’s now plot a stem graph of x to see what our signal looks like
stem(x)The signal is a little crowded since we are using a lot of points. However, if you zoom in on a period you can see it has been reproduced fairly well. Let’s now use our Matlab script that will allow us to take the DFT of this signal.
Y = dft(x)Next, let’s compute the two-sided spectrum on the transform, Y, and then compute the single-sided spectrum from it, similar to Worksheet 11.
P2 = abs(Y/L);
P1 = P2(1:L/2+1);
P1(2:end-1) = 2*P1(2:end-1);
Next, we will define our frequency domain and plot the amplitude spectrum of our signal.
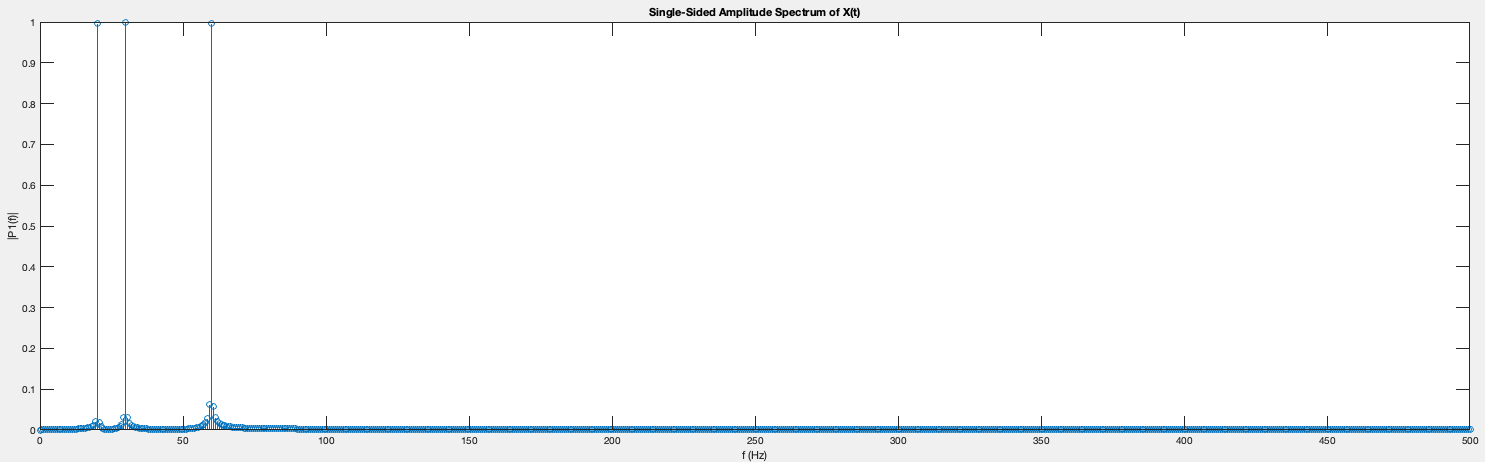
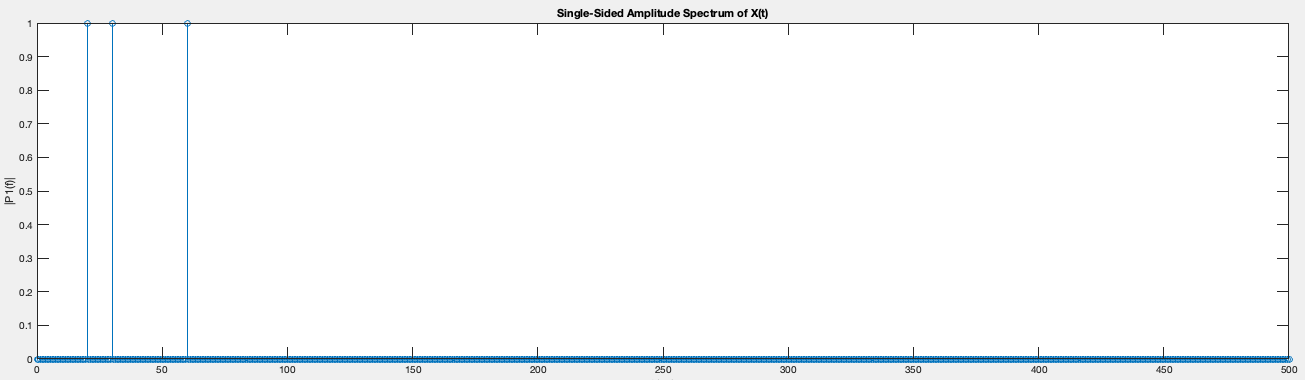
f = Fs*(0:(L/2))/L;
stem(f,P1)
title('Single-Sided Amplitude Spectrum of X(t)')
xlabel('f (Hz)')
ylabel('|P1(f)|')
We can clearly see spikes in our spectrum at 20, 30, and 60Hz!
Now, let us change our program to use Matlab’s in-built FFT function and compare the results.
Y = fft(X);
% Y = dft(X);
With the exception of slightly reduced noise, we have identical graphs that peak at 20, 30, and 60Hz! As a thought experiment, think about why there is reduced noise in this graph.
Now, let’s time the two functions using the tic and toc stopwatch timer built into Matlab. This can be done by simply wrapping the transform section of our code as such:
tic;
% Y = fft(X);
Y = dft(X);
toc;
Let’s run our script using fft() and dft() separately and compare our time. You should get results similar to this:
>> FFT_Worksheet
Elapsed time is 0.000174 seconds.
>> FFT_Worksheet
Elapsed time is 0.030244 seconds.
Where the FFT function is considerably faster than the DFT function. Now try using these methods on a much larger signal and observe the time difference.
Now, let us assume that you are rendering a scene on your computer at full HD resolution. You are processing 1920*1080=2,073,600 pixels, sixty times a second and performing a gaussian blur operation. From this it is clear how FFTs are greatly preferred over standard DFTs due to their speed and reduced complexity.
ENEL 300: Engineering Professional Skills
In this course, I learned how to effectively generate ideas and use research methodology to discuss technical topics. I also learned Agile project management methodology, and applying it to create an electronic device to be used by specific customers.
I particularly found the Agile methodology very useful as it is something I can use in leading the Relectric Car Team. Moreover, I learned about:
- Agile Sprints
- Product backlog
- Iterative design
- Sprint retrospectives
- Team dynamics
- User personas and interviews
- Failing fast
- Ideation of good ideas
I was able to apply those skills by acting as the scrum master on our team. As such, I oversaw, and contributed to, four sprints throughout the semester, which resulted in the successful completion of our project. You can find more about our project here. I believe that my project management skills have improved greatly since the start of this semester.